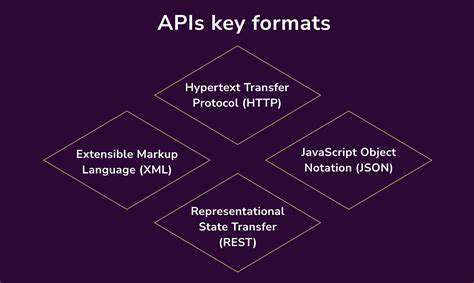
How to Use REST APIs: A Developer's Guide
Understanding the GET Method
When working with web services, the GET method serves as the cornerstone of data retrieval. Unlike other methods, GET operates like a polite inquiry - it asks for information without making changes. What makes GET particularly reliable is its idempotent nature, ensuring identical requests yield consistent results every time. This predictability proves invaluable for caching mechanisms and maintaining data integrity across multiple accesses.
Developers typically implement GET requests in three primary scenarios: fetching complete resource collections, retrieving individual items, or obtaining filtered datasets. Imagine browsing an e-commerce site - when you view product listings, check a specific item's details, or search for products within a certain price range, you're witnessing GET requests in action. The method's read-only characteristic makes it ideal for these information-gathering operations.
Exploring the POST Method
Where GET retrieves, POST creates. This method serves as the digital equivalent of submitting a form - whether registering for an account or uploading new content. Unlike its idempotent counterparts, POST carries inherent variability - submitting the same data twice might create duplicate entries rather than producing identical outcomes. This behavior is by design, accommodating the creation of distinct resources with each submission.
The magic of POST happens in the request body, where developers package the new resource's specifications. Modern APIs typically use JSON format for this payload, containing all necessary attributes for the fresh creation. When you sign up for a new social media profile, every keystroke in the registration form eventually coalesces into a POST request's body, ready to introduce you to the platform's database.
Delving into the PUT Method
PUT operations handle resource updates with surgical precision. Like GET, PUT maintains idempotency - repeatedly applying the same update won't produce different results. This reliability makes PUT indispensable for maintaining data consistency, especially in distributed systems where requests might retry due to network issues.
What distinguishes PUT is its comprehensive approach to updates. Rather than sending partial changes, PUT expects the complete updated resource representation. It's like submitting a revised manuscript instead of sending edit suggestions - the entire document gets replaced. This approach proves particularly useful when you need to ensure all resource attributes align with the current state.
Understanding the DELETE Method
The DELETE method performs the digital equivalent of shredding documents - it permanently removes resources from the server. Like GET and PUT, DELETE operations are idempotent. Attempting to delete an already-removed resource won't produce errors or unexpected outcomes, making the method safe for retries in unreliable network conditions.
However, DELETE operations demand careful consideration of their ripple effects. Modern database systems often implement cascading deletions or reference checks to maintain referential integrity. Before implementing DELETE functionality, developers must thoroughly understand these relationships to prevent unintended data loss or orphaned records.
The Importance of Headers in HTTP Methods
Headers serve as the hidden control panel for HTTP requests, carrying crucial metadata that shapes how servers process each operation. Authentication tokens, content negotiation details, and caching directives all travel within these unassuming key-value pairs. For instance, the Content-Type header acts as a translator, telling the server whether to interpret the body as JSON, XML, or another format.
Security-conscious implementations rely heavily on headers. The Authorization header carries credentials, while CORS-related headers govern cross-origin permissions. Even simple caching headers can dramatically impact performance by reducing unnecessary data transfers. Mastering headers transforms adequate API interactions into optimized, secure exchanges.
Choosing the Right HTTP Method
Selecting appropriate HTTP methods resembles choosing the right tool from a well-organized toolbox. GET for information gathering, POST for creation, PUT for complete updates, and DELETE for removal - this semantic alignment forms the foundation of RESTful design. Misapplication can lead to confusing APIs that behave unpredictably or violate user expectations.
Consistency proves paramount in API design. Establishing clear patterns for method usage helps consumers understand and predict system behavior. Comprehensive documentation bridges any remaining gaps, ensuring developers can integrate with the API efficiently regardless of their experience level.
Error Handling and Troubleshooting API Interactions
Understanding Common Errors
Effective error diagnosis begins with systematic categorization. Technical issues generally fall into three buckets: client-side mistakes (like malformed requests), server problems (such as database failures), and network hiccups (including timeout errors). Accurate classification immediately narrows the troubleshooting focus and suggests appropriate remediation strategies.
Error messages, though sometimes cryptic, contain valuable diagnostic clues. The HTTP status code provides the first indicator - 4xx errors point to client mistakes, while 5xx codes suggest server-side issues. Accompanying messages often specify particular validation failures or system constraints. Learning this error language transforms frustration into focused problem-solving.
Using Logging Mechanisms
Comprehensive logging creates a forensic trail for API interactions. Modern logging solutions capture not just errors but the complete request/response cycle, including timing information and system state. When configured properly, logs reveal patterns that isolated error messages cannot, such as performance degradation preceding failures or specific user behaviors triggering issues.
Effective log analysis requires both breadth and depth. Infrastructure logs track hardware health, application logs record business logic execution, and audit logs preserve security-related events. Correlating across these layers often uncovers root causes that would otherwise remain hidden, particularly in complex distributed systems.
Error Reporting Tools
Dedicated error tracking systems transform random failures into actionable insights. Tools like Sentry or Rollbar aggregate errors across applications, automatically grouping similar incidents and highlighting trends. This aggregation reveals systemic issues that might be missed when examining individual error reports, enabling prioritized fixes based on actual impact.
Advanced features in these platforms provide additional context - user demographics, preceding actions, and even screenshots in client-side applications. This rich contextual data helps reproduce elusive bugs that only manifest under specific conditions, dramatically reducing resolution time for edge cases.
Debugging Techniques
Methodical debugging resembles scientific experimentation - forming hypotheses, testing assumptions, and iterating toward solutions. Modern IDEs offer sophisticated debugging tools including breakpoints, variable inspection, and call stack analysis. Strategic breakpoint placement can isolate problematic code sections without requiring complete execution traces.
For API-specific issues, tools like Postman or cURL allow isolated request testing, eliminating application code variables. Network inspectors like Wireshark capture raw protocol data when SSL/TLS issues obscure higher-level debugging. Combining these approaches creates multiple verification paths to confirm problem sources.
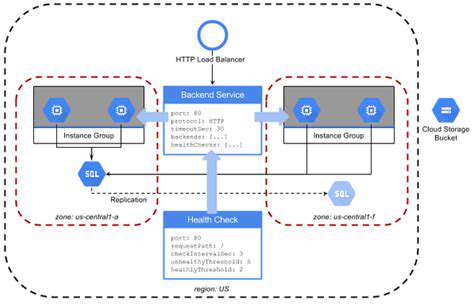
System Monitoring
Proactive monitoring acts as an early warning system for API health. Comprehensive dashboards track key metrics like response times, error rates, and throughput. Anomaly detection algorithms can flag deviations from normal patterns before they impact users, allowing preemptive remediation.
Effective monitoring spans multiple levels - from infrastructure (CPU/memory usage) to application (request queues) to business metrics (failed transactions). Synthetic monitoring from multiple geographic locations provides additional perspective on regional performance variations. Together, these layers form a comprehensive health monitoring system.
Hardware Diagnostics
When errors point to hardware issues, systematic diagnostics identify failing components. Modern servers include extensive self-testing capabilities through IPMI or similar interfaces. Storage subsystems often provide SMART data predicting impending failures, while network interface cards report error counters and packet loss statistics.
For cloud environments, hardware diagnostics shift focus to instance health metrics and virtualization layer performance. Cloud providers offer detailed monitoring interfaces, while third-party tools can aggregate across multiple platforms. In all cases, establishing baseline performance profiles makes anomaly detection more accurate.
User Support and Feedback Mechanisms
User reports provide invaluable qualitative data that automated systems might miss. Structured feedback channels (like in-app reporting) coupled with analysis tools create a continuous improvement loop. Particularly insightful users often describe workarounds or environmental factors that automated logging overlooks.
Effective feedback systems categorize and prioritize user-submitted issues while preventing duplicate submissions. Integration with development tracking systems ensures reported problems flow directly into engineering workflows. Closing the loop by informing users of fixes builds trust and encourages future engagement with support channels.
Read more about How to Use REST APIs: A Developer's Guide


Hot Recommendations
- Review: The New [Specific Brand] Smart Lock Is It Secure?
- Best Budget Studio Monitors for Music Production
- Top Flight Simulation Peripherals (Joysticks, Throttles, etc.)
- Top Portable Scanners for Document Management On the Go
- Reviewing the Latest Smart Air Purifiers for Your Home
- Best Portable Photo Printers for Travelers and Memory Keepers
- The Future of Personal Transportation Beyond Cars (Hyperloop, eVTOL)
- Top Network Monitoring Tools [Free & Paid Options]
- Understanding the Tech Behind mRNA Vaccines [A Look Inside]
- Guide to Choosing the Right Gaming Chair for Ergonomics