Debugging Code: Essential Tips for Beginners
Understanding the Error Messages
The first step in debugging any code is to meticulously examine the error messages generated by the compiler or runtime environment. These messages often contain crucial clues about the source of the problem, including the specific line number where the error occurred and a description of the issue. Carefully analyzing these messages can save significant time and effort compared to blindly searching for the problem. Taking the time to understand the precise nature of the error, such as a syntax error, a type mismatch, or a null pointer exception, is paramount to making informed debugging decisions. By paying close attention to these error messages and understanding the terminology, you can quickly narrow down the possibilities and efficiently pinpoint the root cause.
Don't just skim the error message; read it thoroughly. Look for keywords, specific file names, and line numbers. These details can provide invaluable context to guide your debugging efforts. Often, error messages include suggestions or recommendations for resolving the issue, and taking the time to understand these recommendations can significantly expedite the debugging process. Furthermore, if the error message is vague or unclear, try to reproduce the issue in a simplified, controlled environment to isolate the specific conditions triggering the error, which can help you formulate more precise debugging steps.
Inspecting the Code Around the Error
Once you have a clearer understanding of the error message, focus on the code surrounding the problematic line. Look for potential issues such as typos, incorrect variable assignments, or logical errors in the surrounding code blocks. This step involves careful code review, paying attention to data flow, variable values, and function calls leading up to the error point. Consider using print statements or logging to track the values of key variables as the code executes. This allows you to monitor the state of the program at different points, helping identify where the data deviates from the expected behavior.
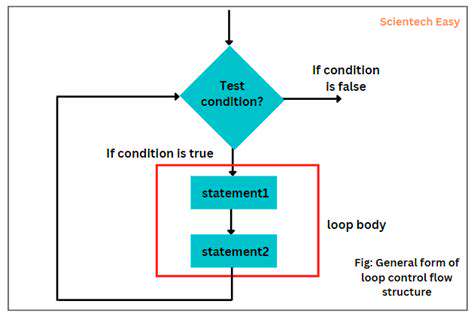
Pay close attention to conditional statements, loops, and function calls. Incorrect logic within these structures can easily lead to unexpected behavior and errors. Step through the code line by line, or use a debugger if available, to observe the flow of execution and the values of variables in real-time. This will help you understand the sequence of events that led to the error and identify the specific point where something went wrong.
Utilizing Debugging Tools and Techniques
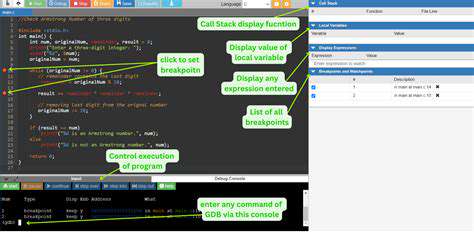
Debugging tools, such as debuggers, can significantly assist in identifying the source of problems. Debuggers allow you to step through the code line by line, inspect the values of variables, and set breakpoints to pause execution at specific points. This interactive approach to code analysis provides a powerful method for tracking the flow of execution and examining the state of the program. Using debuggers is an excellent way to understand the exact sequence of events that lead to the error condition, as it allows you to visually follow the code's behavior.
If no debugger is available or appropriate, consider using logging or print statements to track the program's execution. These techniques involve inserting print statements to display the values of variables at different points in the code. This provides a way to observe the program's behavior and identify inconsistencies or unexpected values. This approach enables you to trace the program's flow and pinpoint the exact location where the error occurs. Careful use of logging or print statements, coupled with thorough analysis, can often lead to a swift resolution to debugging challenges.
Testing different scenarios and edge cases is crucial in identifying the source of a problem. Create test cases that simulate different inputs and situations, and examine how the code responds to each condition. This allows you to uncover subtle errors or unexpected behavior that might not be apparent in normal use cases. By systematically testing various inputs, you can improve your confidence in the code's correctness and identify the specific conditions that trigger the bug.
Using Print Statements Strategically: The Simple Approach
Understanding the Purpose of Print Statements
Print statements are fundamental debugging tools. They allow you to inspect the values of variables, track the flow of execution, and identify potential issues within your code. Instead of relying solely on error messages, which often point to a symptom rather than the root cause, print statements provide a direct view into the program's internal state at specific points. This direct observation is crucial for isolating problems and understanding program behavior.
By strategically placing print statements, you gain insight into intermediate calculations, data transformations, and conditional outcomes. This visibility is invaluable in diagnosing errors and streamlining the debugging process. Understanding the purpose of print statements is the first step to leveraging them effectively.
Choosing the Right Variables to Print
Not every variable needs to be printed. Focus on variables that hold critical data or those that are expected to change as the program runs. Identify variables where the expected value differs from the actual value. Selecting the right variables to monitor is essential for efficient debugging. Carefully consider which values are truly informative, and avoid cluttering your output with irrelevant details.
For example, if you are debugging a loop, printing the loop counter and the value of a relevant variable within the loop can help you quickly spot patterns and inconsistencies. Print statements should be targeted, not indiscriminate.
Strategic Placement for Tracing Program Flow
Print statements should be strategically placed to trace the flow of execution within your code. This involves inserting print statements at key decision points, loop entry/exit points, and function calls. Visualizing the program's path helps to understand where the execution diverges from the expected behavior.
For instance, if you suspect an issue in a specific function, placing print statements at the function's entry and exit points can help to determine if the function is being called correctly and if it's returning the expected results. This method allows you to pinpoint the exact location of the problem.
Formatting Print Statements for Readability
Clear and concise formatting is crucial for debugging. Use descriptive labels for the variables being printed, separating different values with appropriate delimiters (like commas or newlines). Well-formatted output makes it easier to identify and interpret the data quickly.
Avoid printing raw data structures without appropriate formatting. Convert complex data structures to a human-readable representation before printing. This makes it much easier to identify issues with data integrity and correctness.
Using Print Statements for Conditional Debugging
Print statements can be used conditionally, enabling selective output based on specific conditions. This is particularly useful when debugging complex logic or when you want to avoid flooding the output with unnecessary information.
For example, if you're debugging a function that's only called under certain circumstances, you could use conditional print statements to display information only when that condition is met. This approach helps narrow the focus and maintain clarity during the debugging process.
Removing Print Statements After Debugging
Once you've identified the issue, it's essential to remove or comment out the print statements. Leaving them in your production code can introduce unexpected behavior or performance issues. Maintaining a clean codebase is crucial for long-term sustainability and maintainability.
Remember to clean up your code after debugging. Print statements are temporary aids, and removing them ensures that the final product is optimized and free of unnecessary code. This step is often overlooked but is a critical part of the debugging process.
Testing and Verifying with Print Statements
Print statements can be used as a form of testing. By strategically placing print statements within loops or conditional blocks, you can verify that the code is behaving as expected. This approach of using print statements as a test is an important step in verifying the code's functionality. By checking the output during runtime, you can ensure that the program is performing the required calculations and operations correctly.
Using print statements within test functions can help validate that your functions are operating correctly and returning the expected values for various input scenarios. This is a vital step in the debugging process, ensuring that the code is working as intended and will function reliably in production.
Read more about Debugging Code: Essential Tips for Beginners


![Understanding Cryptocurrency: Beyond Bitcoin [Explained]](/static/images/25/2025-05/TheFutureofCryptocurrencies3ANavigatingtheChallengesandOpportunities.jpg)


Hot Recommendations
- Review: The New [Specific Brand] Smart Lock Is It Secure?
- Best Budget Studio Monitors for Music Production
- Top Flight Simulation Peripherals (Joysticks, Throttles, etc.)
- Top Portable Scanners for Document Management On the Go
- Reviewing the Latest Smart Air Purifiers for Your Home
- Best Portable Photo Printers for Travelers and Memory Keepers
- The Future of Personal Transportation Beyond Cars (Hyperloop, eVTOL)
- Top Network Monitoring Tools [Free & Paid Options]
- Understanding the Tech Behind mRNA Vaccines [A Look Inside]
- Guide to Choosing the Right Gaming Chair for Ergonomics